|
|
Post by Big D on Mar 3, 2010 19:56:09 GMT -6
UIC at Milwaukee (HL Tourney, 1st Round)  Season (30 games) * 5 min/game minimum  |
|
|
|
Post by Big D on Mar 3, 2010 19:58:56 GMT -6
Here's the NBA Efficiency graph through 30 games...I think this shows we were definitely playing our best ball at the end, especially the last 8 or so games...but too little, too late, and still not good enough to beat just average teams night in and night out!  |
|
|
|
Post by Big D on Mar 3, 2010 20:09:00 GMT -6
Here are the average NBA efficiencies for the five players that got the most minutes on the team this year. Buttell was definitely the standout when it comes to NBA efficiency, particularly during the 2nd half of the season when he raised his efficiency average practically every game. I know it may be kind of tough to see, but Kreps is the dark blue (finishes in the middle of the others). Looks like all but Buttell slumped big time during the middle portion of the season when we were playing awful. 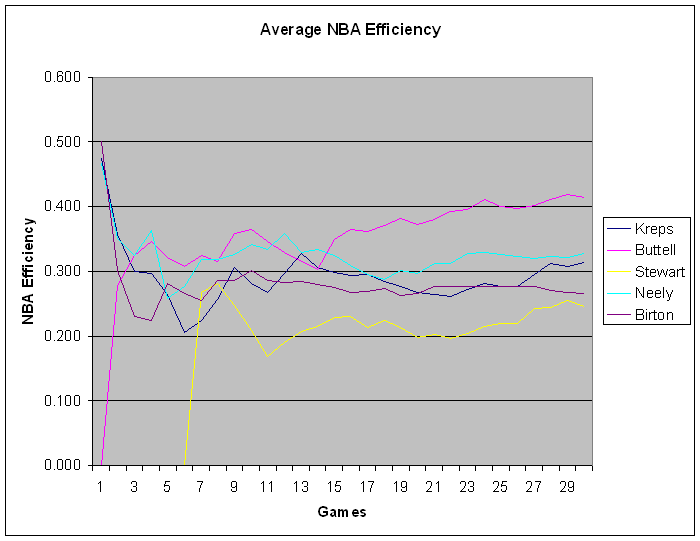 |
|
|
|
Post by Big D on Mar 3, 2010 20:22:54 GMT -6
Here are the average NBA efficiencies for the remaining guys on the team that averaged 5+ minutes. 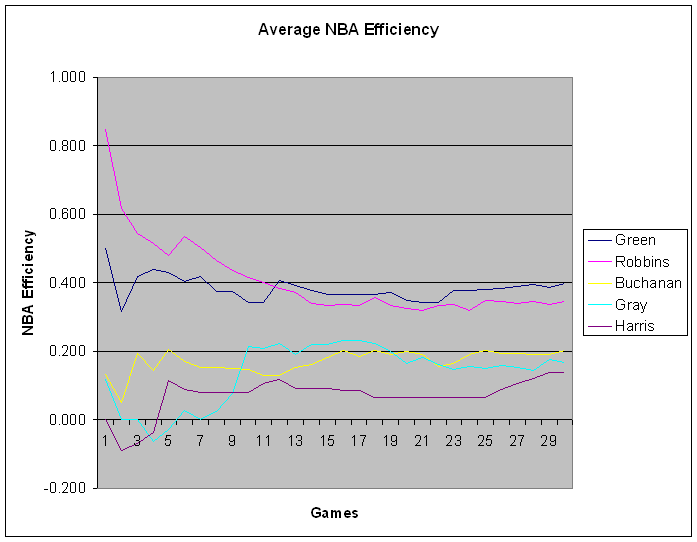 |
|
|
|
Post by shorehaven on Feb 2, 2011 14:56:25 GMT -6
Comparison between the last two years is telling.
|
|
|
|
Post by Big D on Feb 2, 2011 22:06:15 GMT -6
Comparison between the last two years is telling. In what way? The overall team average seems about the same....too low at under .300/game. We might be slightly higher as a team this year than last year at the same time (which, considering our depth and the amount of time walk-ons are getting, may indicate that Moore is doing the same, if not better, with less...efficiency-wise, that is). Curious on your interpretation. |
|
|
|
Post by shorehaven on Feb 3, 2011 15:16:18 GMT -6
Big D,
I wanted to compare Kreps, Birtin and Robbins after 22 games year over year considering different coach(s), system and Jr. to Sr. year development.
Kreps went from .277 to .335 or a 21% improvement.
Birtin .262 to .330 or a 26% improvement and
Robbins .334 to .416 or a 25% improvement.
Regardless of what some think about the NBA Efficiency Rating it does compare key, like stats and they do tell a story of consistency...and the value of getting your top performers and seniors on the floor as much as possible.
Your work is appreciated and telling.
|
|


